
Creating Visuals with Custom Queries
Drive a tile from SQL you write yourself — without giving up any of the features drag-and-drop tiles get.
Visuals created with custom queries restrict nothing. You can still let readers filter with filter components, paginate data, drill down, run AI models, and everything else.
Step 1: Create a Tile
Click and drag in an empty area of the canvas to create a new tile.
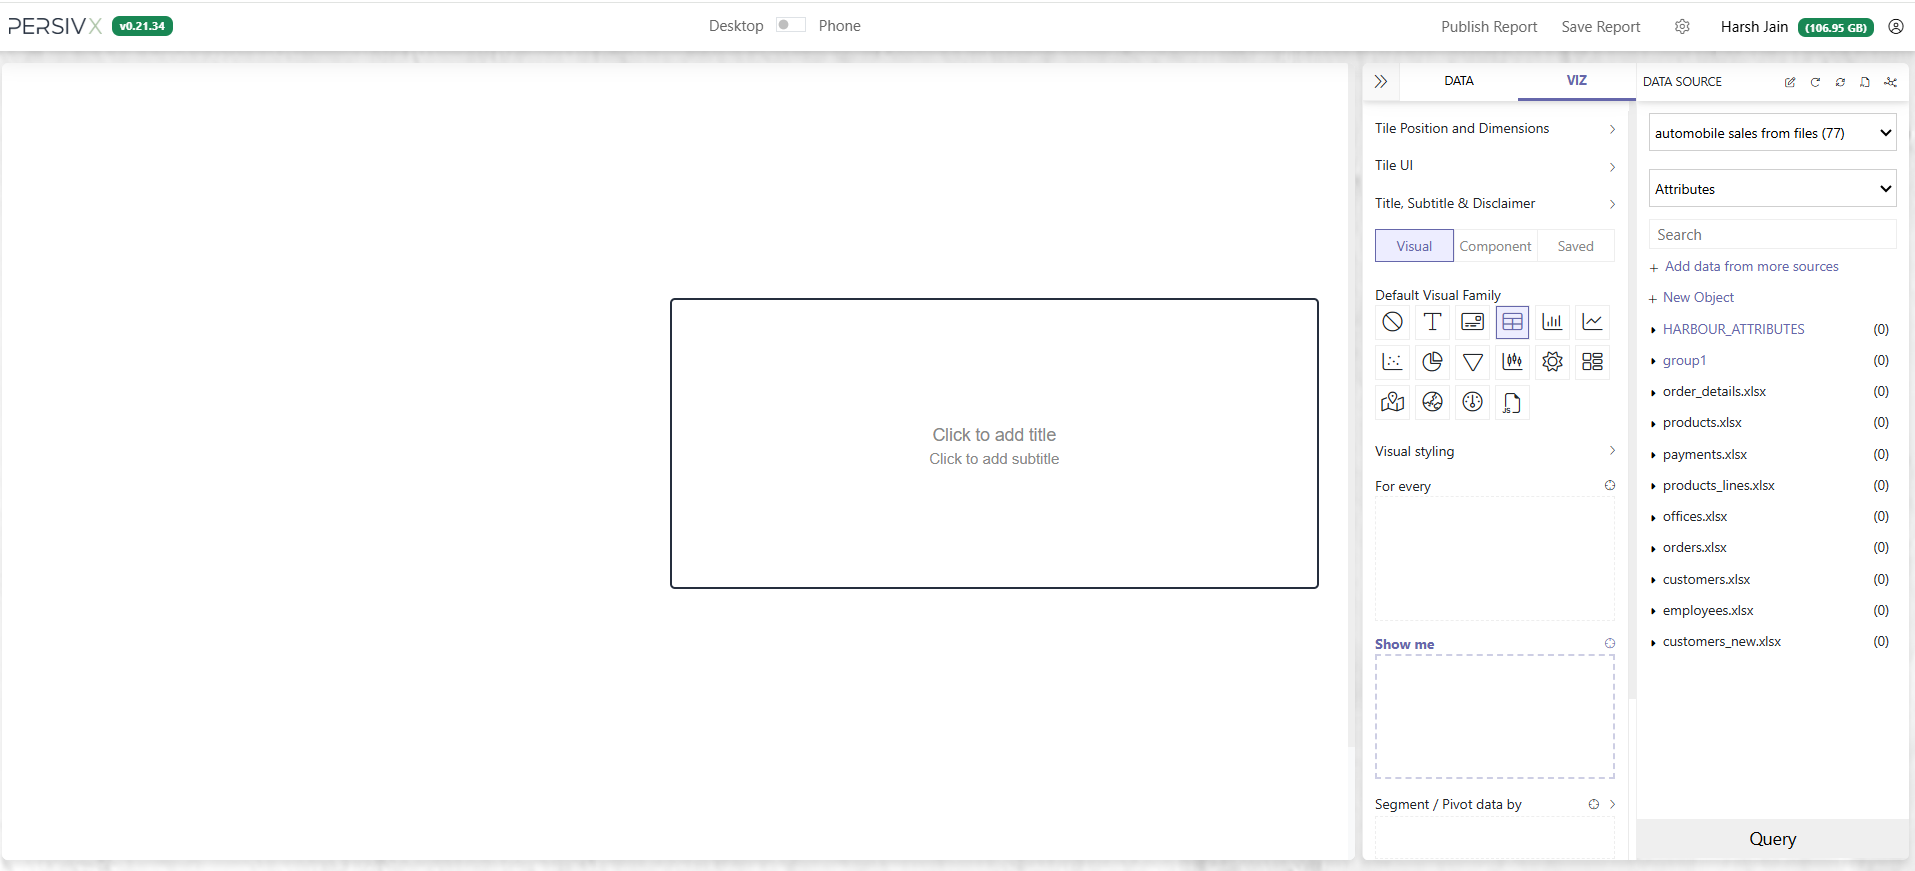
Step 2: Switch the Tile to Query Mode
Open the tile menu and, under Query & Transform, click Use Query to fetch data.
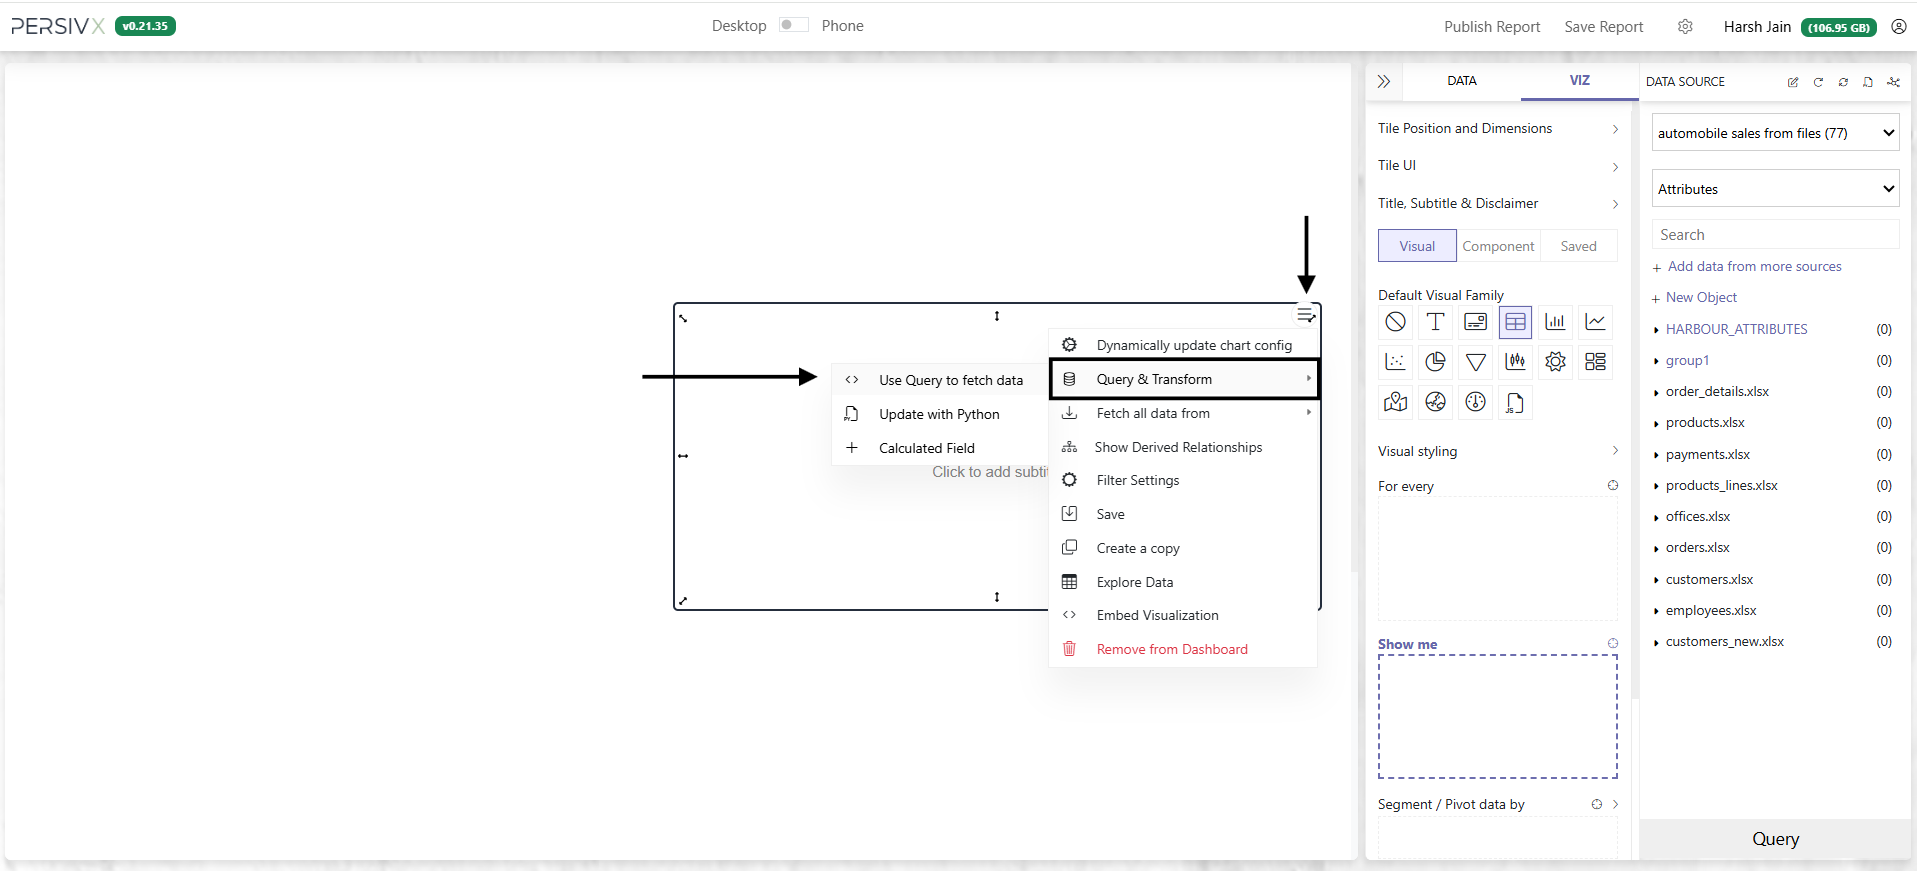
Step 3: Write the Query
The query editor opens. Write the query that fetches the data you want.
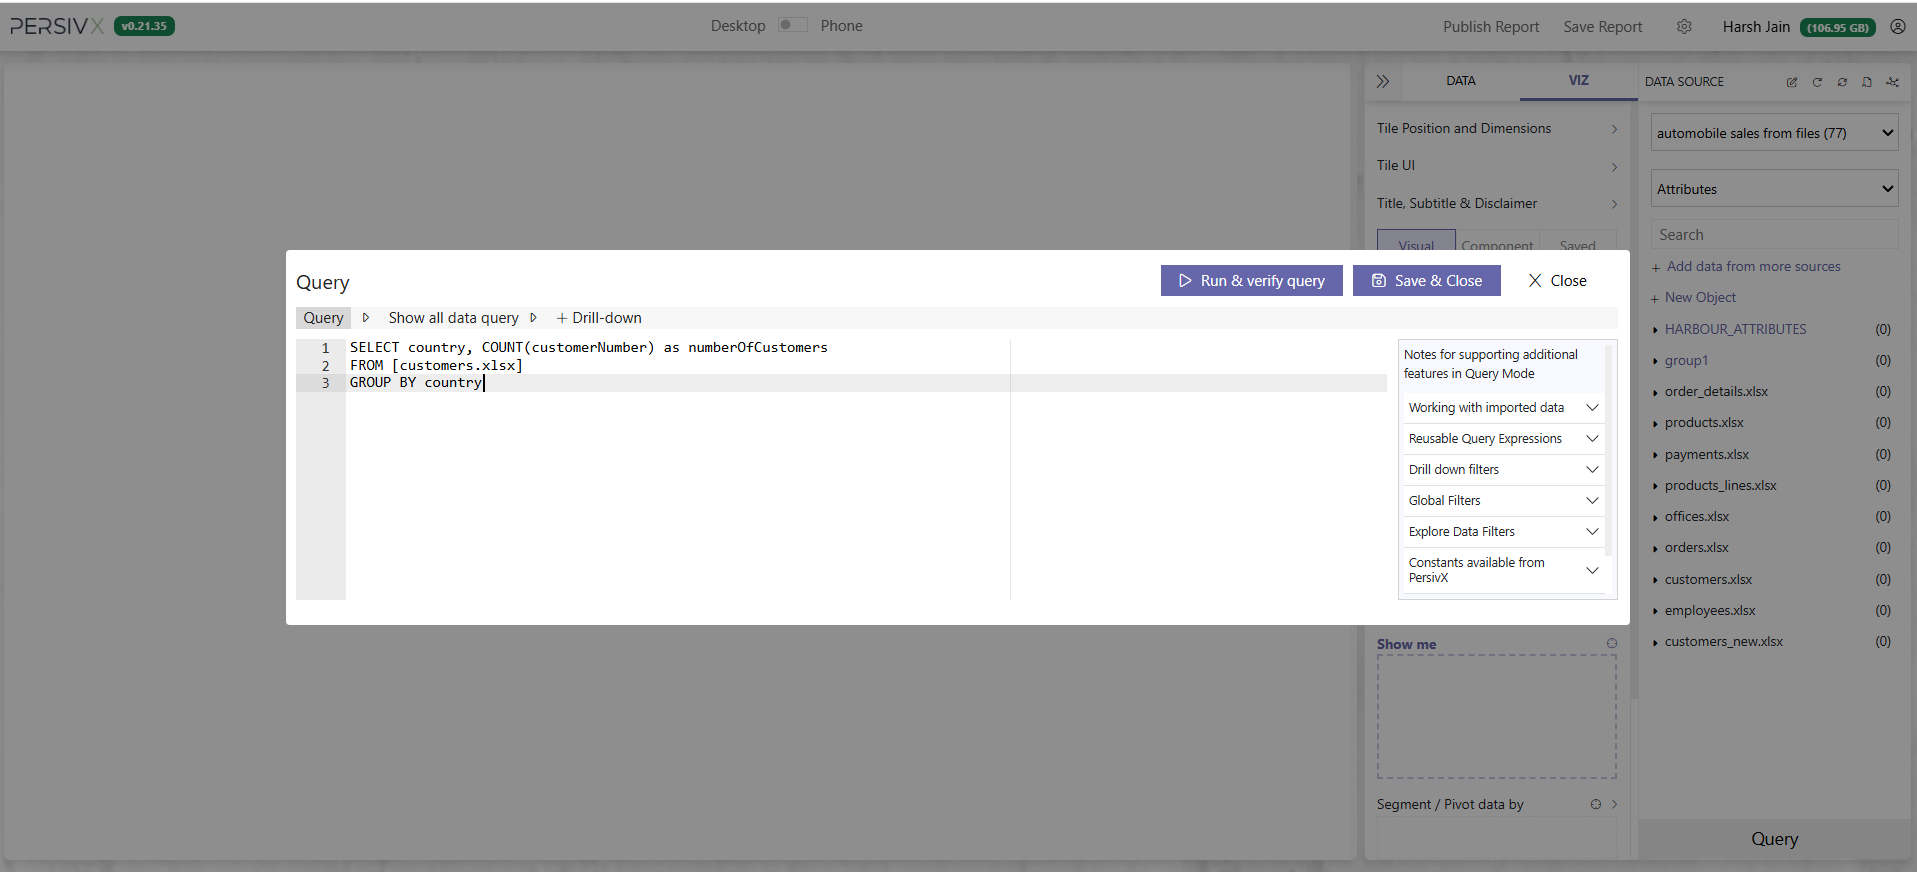
Step 4: Verify the Query
Click Run & verify query to confirm there are no errors.
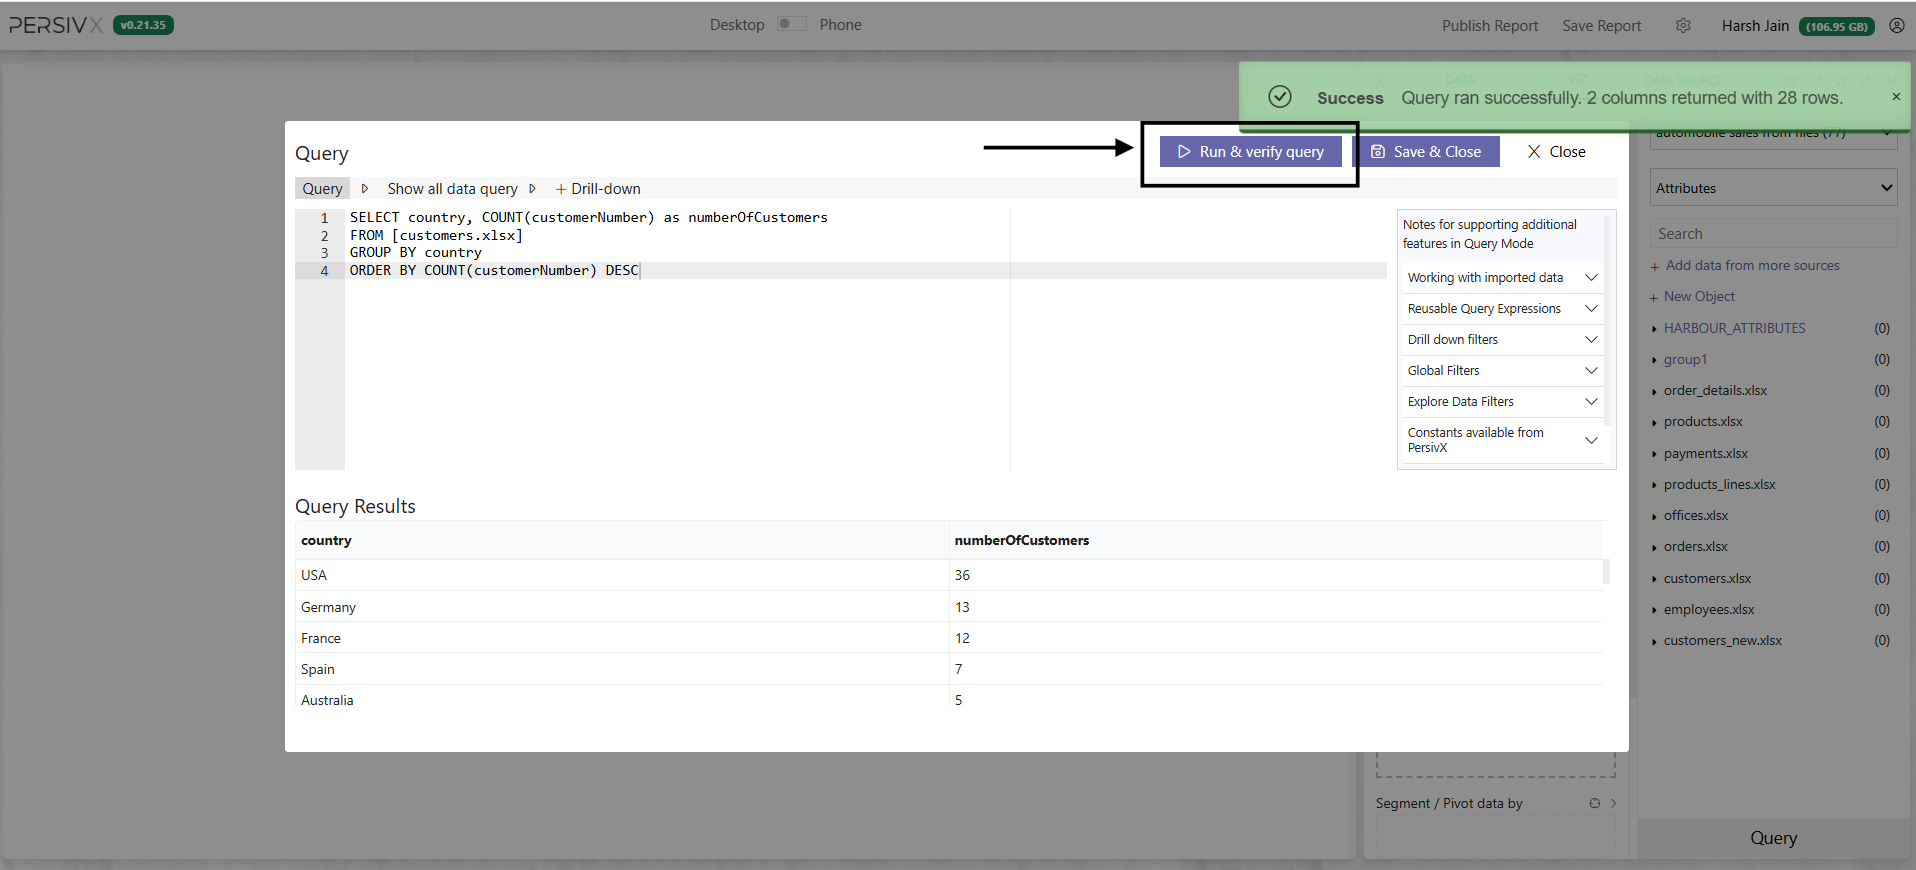
Step 5: Save
As soon as you click Save, PersivX builds the visual and shows the columns in the customization panel. From here you can customize the visual exactly as if it had been created with drag and drop.
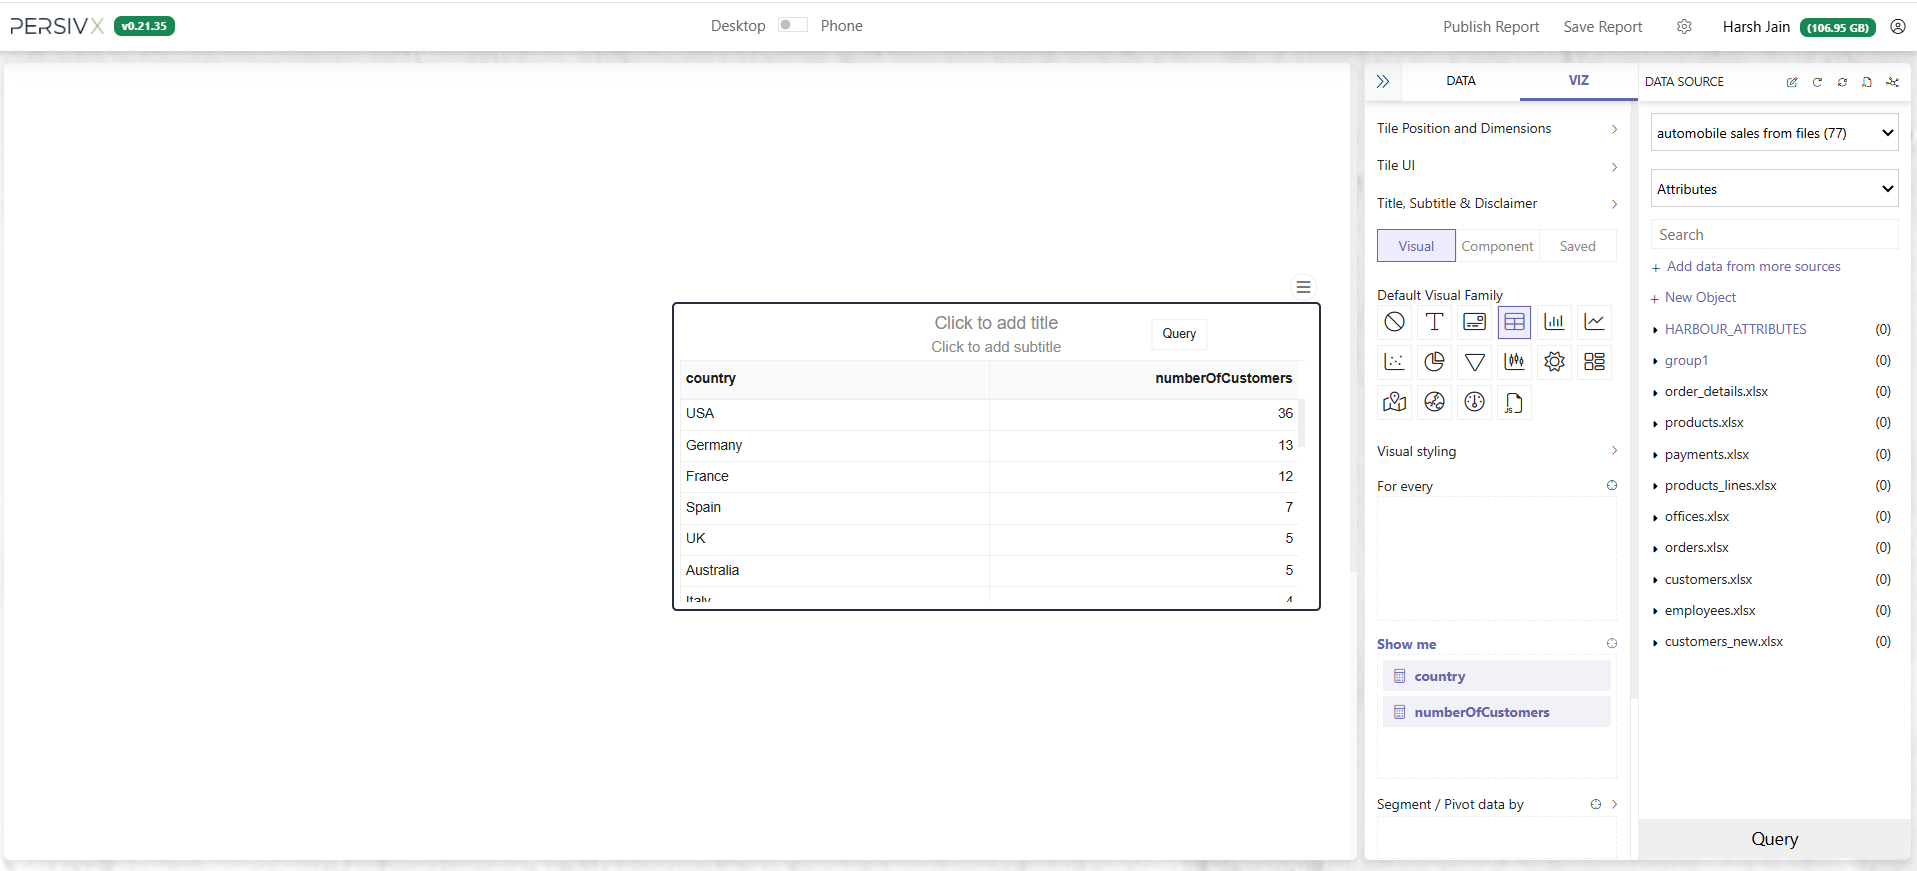
Step 6: Arrange and Customize
Arrange the attributes into the correct boxes, convert the visual to a bar chart, and style it. These steps are identical to those in Customizing Visuals.
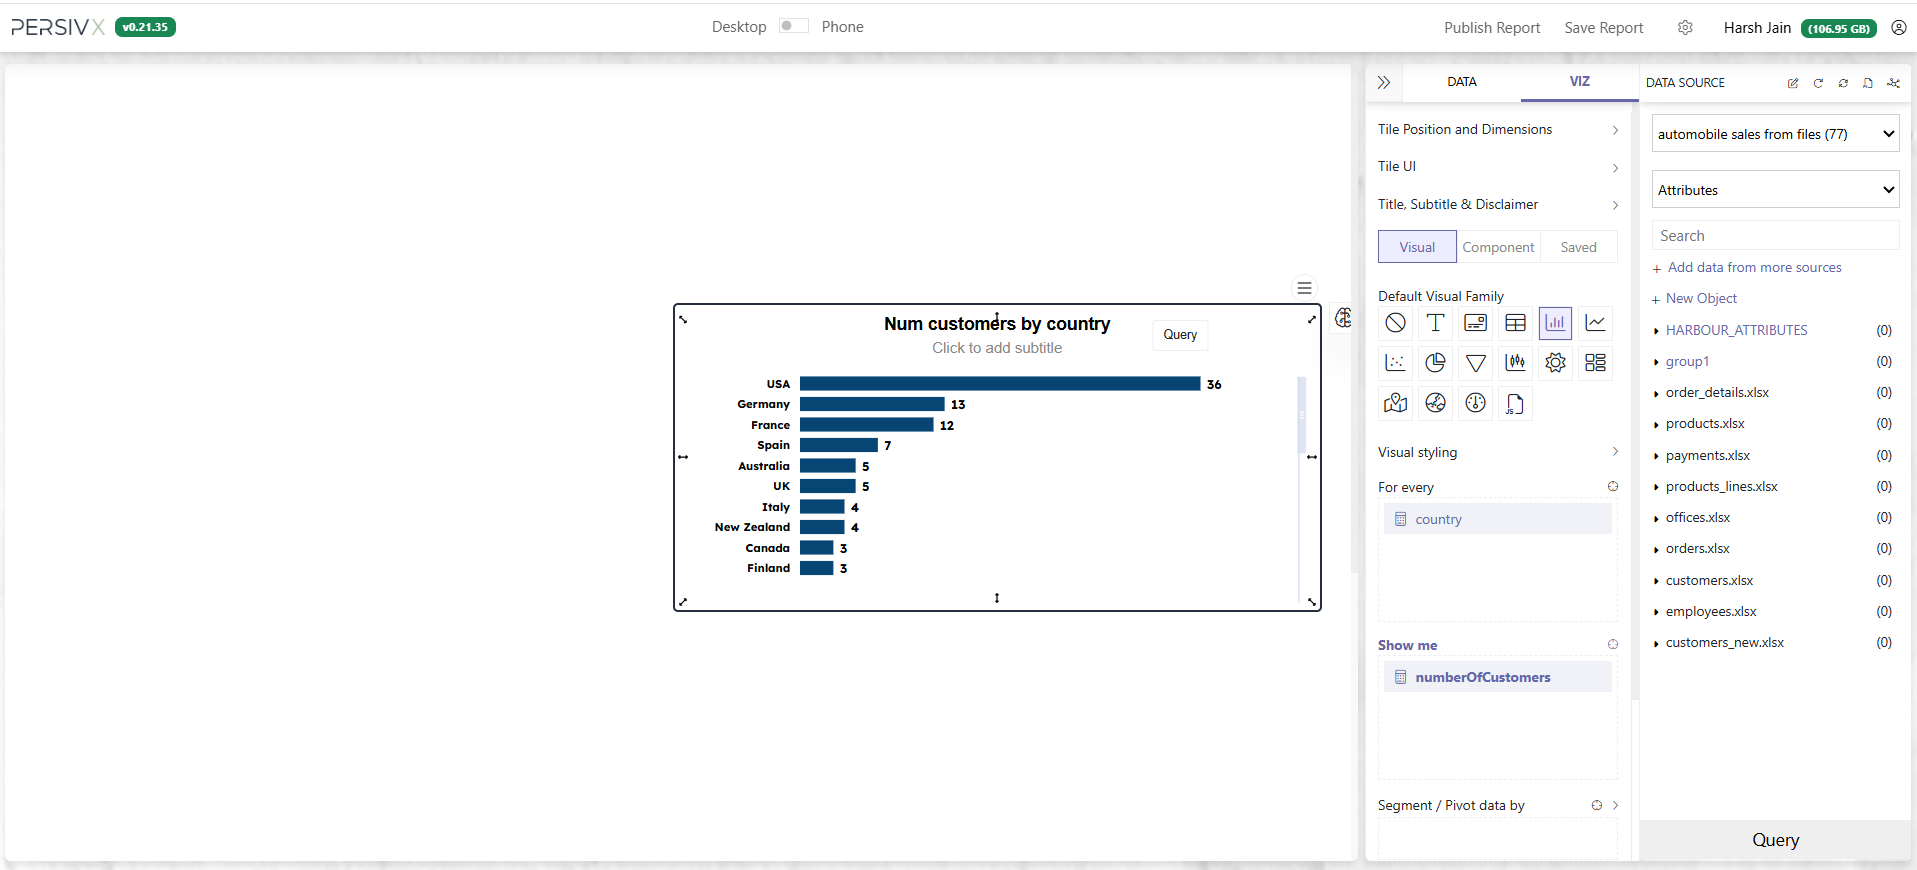
Running the Query on Another Datasource
A query normally runs on the tile's own datasource. To run it on a different one, add :USE_DS: with the datasource's id anywhere in the query:
:USE_DS:262:
SELECT LINEID, COUNT(*) FROM WIP_SN_COLLECTION_INFO GROUP BY LINEID
To let readers choose the datasource, take the id from a query parameter. This is written like :USE_PARAM:, with one datasource id per option:
:USE_DS:[Params].[line]:l3(262):l4(263):
SELECT ... WHERE LINEID = :USE_PARAM:[Params].[line]:l3('L3'):l4('L4'):
Here, picking l3 runs the query on datasource 262 with LINEID = 'L3', and picking l4 runs it on datasource 263 with LINEID = 'L4'. The tile re-runs whenever the parameter changes.
- The whole query runs on the chosen datasource, so write it in that database's SQL dialect, and make sure every table it uses exists there.
- Parameters, what-if parameters and query expressions are still read from the tile's own datasource. You don't need to recreate them on the other one.
- Filters and data governance rules are applied using the chosen datasource.
- A query can use only one datasource. If two
:USE_DS:hints resolve to different ids, the query fails with an error. - You can only switch to a datasource that belongs to the same organization.
To combine data from several datasources in one visual, see Combining Data from Multiple Datasources.